Projects:
P33 Dashboard Project
Motivation: I am a strong believer that every problem can be solved and should be solved by using data. However, data is all over the place, but we need it to be easily accessible any time we need it. And that is why I see my dashboard project as a one-stop shop for P33’s important data.

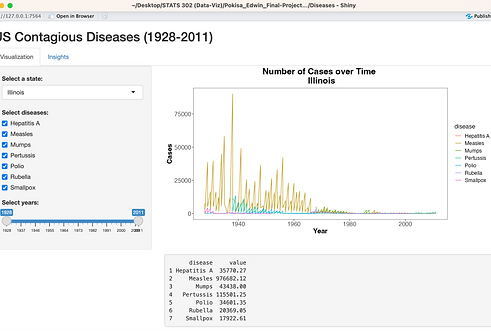
Data Visualization Project
This project visualizes the number of contagious disease cases in the US between 1928 and 2011, broken down by state, disease, and time. I developed this data visualization project/dashboard using R and an R Shiny app. The interactive app allows users to explore patterns and trends in the data, providing insights into the changing landscape of disease incidence over the years.
Davis Projects for Peace
I founded a project to develop a cooperative business model that involved honey-making and bead-making that created awareness about the Yaaku’s culture.
